
On January 23, 2018, this June 19, 2014 post was reconstructed due to new information about the families discussed herein. When it was originally published, our three surname researchers had been under the estimation for nearly three decades that the Owston family from Ganton in the original East Riding of Yorkshire was originally descended from Giles Owston (d. 1641) and his progeny who lived in this same parish from the 16th through the 18th centuries.
However, recently released Big Y results and a reexamination of the records of three parishes indicate that the current Ganton Owstons are actually a branch of the Sherburn family and not a distinct family at all. This was something that was not overtly evident in the original records and could not be determined with either STR or autosomal DNA testing.
While the new data places these participants at a closer relationship level than originally thought, it does not conflict with our original premise from 2014. In addition, more recent results are used in this update, as we are able to move the comparison from 59 to 253 relationships.
INTRODUCTION:
While obviously having a small pool of potential Y-DNA participants, low frequency surnames may have the advantage of having good documentation of ancestry. That is the case with my surname and its corresponding Y-DNA Project. The original intent of our project was to see if three families (at the time) bearing our surname from the original East Riding of Yorkshire had a common ancestry or if the surname was applied to these lineages independently from each other. Since the original writing, the number of distinct families has been reduced from three to two.
The two extant families are as follows:
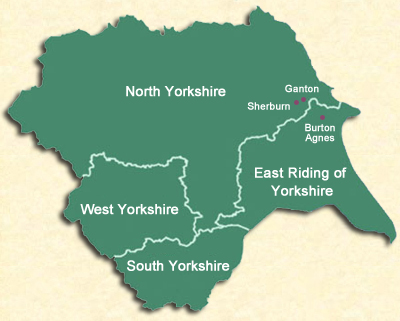
| SHERBURN: The largest Owston family hails originally from Sherburn in Harford Lythe and its many members descend from Peter Owston who died in 1568. This group also includes the Ouston descendants of James Ouston (1711-1785) who was born in Brompton by Sawdon and who died in Sigglesthorne. You’ll find members of this clan in the UK, Australia, USA, Canada, New Zealand, Nicaragua, and Italy. Ninety-one percent (yes, we counted) of all Owston and Ouston males descend from the Sherburn family. |
| THORNHOLME: The second group of Owstons from 15 miles south of Sherburn and Ganton can be traced to Richard Owston of the village of Thornholme in the parish of Burton Agnes. Richard Owston died in 1739. By using onomastic evidence, it is possible to theorize a connection to an earlier Ganton line fathered by Robert Owston who was born in the 16th century. The names Richard, Michael, and Matthew appear both in the later Thornholme family as well as in the extinct Robert Owston of Ganton family. The Thornholme Owstons are found in Canada, Australia, the UK, Finland, and New Zealand. Only 25 males descend from the smaller Thornholme family. |
In the study’s first year, a positive conclusion was reached; as three participants (one from each identified family at the time) matched each other at 100% using 43 Y-DNA marker tests from GeneTree. Others in the study matched at a genetic distance of 2 and 3.
This was exciting news, as it was impossible to determine a relationship between these lineages, as the connection between these families apparently occurred before the introduction of English parish registers in 1538.
The first record of the surname in the region (spelled as Oustyn) appeared in a 1452 will from the parish of Wintringham. By the 16th century, the surname began to ramify within a five mile radius of Ganton and was found in Ganton, Staxton in Willerby, Sherburn, Foxholes, and West Heslerton - all presently in the Ryedale District of North Yorkshire.
GROWTH OF THE PROJECT:
In order to better understand our relationships and to construct a more conclusive modal haplotype of the Owston families, it was necessary to branch out beyond our original participants and attempt to test as many Owston/Ouston males as possible. We have identified 23 lines from the two families. Some lines can further be subdivided into groups that we call segments. Currently, there are 37 segments and unsegmented lines.
As of 2018, the Owston/Ouston DNA project has 33 Y-DNA participants – 28 Sherburn family members and 5 Thornholme participants. The participants represent at least one person from 20 of the 23 lines and 26 of the 37 lines and segments. Additionally, some lines/segments have more than one participant. All five Thornholme lines are represented. For a look at the charts, see http://www.owston.com/family/owston/Owston_Family_Charts.pdf.
Of the 33 participants, one individual is awaiting awaiting test results. Nine of the remaining individuals failed to match the modal haplotype and are apparently the results of non paternal events (NPEs). Several of these participants descended from families where known NPEs existed, while others’ results were a complete surprise. It is to be noted that everyone who tested had a clear paper genealogical line to one of the two original families. It is estimated that one-third of Owston/Ouston males have an ancestral NPE; this number may be even greater.
GENETIC DISTANCE:
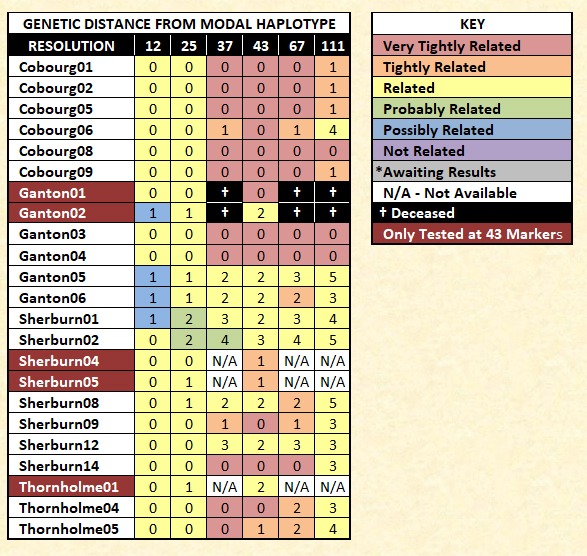
Currently, 23 of the participants have a solid match to the modal haplotype. These represent three Thornholme participants and 20 Sherburn participants. Early in this study, we noticed that some individuals were inclined to have closer genetic matches with participants who were genealogically more distant than those who were more closely related. This was a curiosity that led to the eventual writing of this post and the raising of 18 participants' STR resolutions to 111 markers. It also influenced our testing of 15 participants with FTDNA's Big Y test (3 tests are currently pending).
Over the years, genetic genealogists have tended to rely upon genetic distance to help predict a range of possible relationships. In fact, FTDNA qualifies matches at various levels of genetic distance.
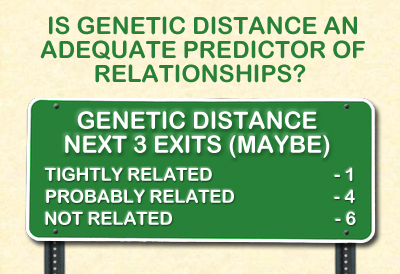
For example, FTDNA states that a GD=0 at 37 markers indicates that the two individuals are “very tightly related”; and with a confidence level of .05 or less, FTDNA estimates that these individuals are related within eight generations (seventh cousins). A mismatch of one GD is considered “tightly related.” Genetic distances at 2 or 3 marker differences between men of the same surname are identified as “related.” As GD increases, the likelihood of a relationship diminishes with a GD=6 as considered as being not related, even when the same surname is present (Canada, 2011).
In addition, most of us have genetically close matches with individuals who obviously are further back on the relationship continuum and do not share a common surname or variant. At 37 markers, I have a number of matches with individuals whose ancestry hails from distances far removed from my own East Riding ancestors. While we are related, the connection is likely before the genealogical time frame and may be prior to the various invasions of Britain – one of which brought my ancestors from mainland Europe.
Using my project as a case study, I have hypothesized that, although a predictor of a familial connection, genetic distance is an inadequate predictor of relationships. Before I discuss my results, I must present some caveats.
First of all, I cannot confirm the exact connection between the two families in my study; however, I have constructed plausible trees based on shared forenames, typical naming conventions, names found in wills and other local records, and the close geographical distances among both current families and three earlier extinct families. Currently, we can only affirm the relationship intra-family; however, based on the aforementioned factors, we are confident that the supposed relationships are close to the unknown actual relationships. The closest possible relationships are used in this analysis and should be no more distant than two generations, but due to different downstream SNP markers, the relationships are not any closer.
Secondly, not all 23 matching participants tested at the same level of resolution. Five participants tested only at 43 markers at the now defunct GeneTree. Two of these men are deceased. We have been attempting to get the remaining three to upgrade at Family Tree DNA. Hopefully, at least two key participants will agree to a retest in 2018. One is critical as he is the last male in his line. We were successful in 2016 in retesting the last male in another line, as he died in late 2017.
In the original post, we compared all 37 marker tests to each other and all 43 marker tests to each other. The original combined analysis had only 59 compared relationships. In this new analysis, we compare 153 relationships at 37 markers and 253 at 43 markers. We only include the 43 marker results in order to use the data from the five participants who have only tested at 43 markers. These five can be compared to the 18 participants who have tested at 111 markers, as the additional markers at 43 are found within FTDNA's 111 STR markers.
Third, there were only five participants with close relationships (fifth cousins and closer) in the original analysis; therefore, the mean TMRCA (time to the most recent common ancestor) skewed more distant. We now have 26 relationships at the fifth cousin level or closer.
The relationships are as follows:
| Relationships | Number |
| Father/Son | 1 |
| Brothers | 1 |
| Uncle/Nephew | 2 |
| 1st Cousins, Once Removed | 1 |
| 2nd Cousins | 3 |
| 2nd Cousins, Once Removed | 3 |
| 3rd Cousins, Once Removed | 1 |
| 4th Cousins | 7 |
| 4th Cousins, Once Removed | 4 |
| 5th Cousins | 3 |
| 5th Cousins, Once Removed | 5 |
| 6th Cousins | 2 |
| 6th Cousins, Once Removed | 1 |
| 7th Cousins | 4 |
| 7th Cousins, Once Removed | 6 |
| 7th Cousins, Twice Removed | 1 |
| 8th Cousins | 23 |
| 8th Cousins, Once Removed | 29 |
| 8th Cousins, Twice Removed | 4 |
| 9th Cousins | 30 |
| 9th Cousins, Once Removed | 21 |
| 9th Cousins, Thrice Removed | 2 |
| 10th Cousins | 4 |
| 10th Cousins, Twice Removed | 24 |
| 11th Cousins, Once Removed | 10 |
| 12th Cousins* | 1 |
| 12th Cousins, Once Removed* | 14 |
| 12th Cousins, Twice Removed* | 5 |
| 12th Cousins, Thrice Removed* | 1 |
| 13th Cousins* | 24 |
| 13th Cousins, Once Removed* | 10 |
| 13th Cousins, Twice Removed* | 5 |
| 13th Cousins, Thrice Removed* | 1 |
| *The exact relationships between members of the Sherburn and Thornholme families are not presently known. These relationships are estimated through onomastic evidence and references in wills; the assumed relationships are listed at the closest possible level; however, they may be one or two more generations further distant, but not any closer, as the families have distinct SNP signatures beyond their common I-A10206 SNP. |
A relationship listed with a .5 value (i.e., 1.5, 5.5, 14.5) indicates that the two parties are from different generations. For instance, 9th cousins, once removed are categorized as having at TMRCA of 10.5 generations. One member of the pair has a TMRCA of 10 generations, while the other individual has a TMRCA of 11 generations. The compromise is 10.5 generations for the relationship's common ancestor.
37 MARKER ANALYSIS:
Often considered a baseline reliable STR resolution, the 37 marker test from FTDNA is generally considered the entry point for many Y-DNA participants. Of our 153 relationships at this resolution, the following chart illustrates the range of time to the most recent common ancestors (TMRCA) and the mean (mathematical average). Finally, the mean is rounded to the nearest .5 to determine the adjusted mean relationships.
| GD | n | MIN TMRCA | MAX TMRCA | MEAN TMRCA | ADJUSTED MEAN RELATIONSHIP |
| 0 | 46 | 1.0 | 14.5 | 9.90 | 9th Cousins |
| 1 | 20 | 3.0 | 14.5 | 9.20 | 8th Cousins |
| 2 | 31 | 3.5 | 14.5 | 9.69 | 8th Cousins, Once Removed |
| 3 | 28 | 5.0 | 15.0 | 11.11 | 10th Cousins |
| 4 | 16 | 5.5 | 13.5 | 10.06 | 9th Cousins |
| 5 | 9 | 8.5 | 12.0 | 10.06 | 9th Cousins |
| 6 | 2 | 10.0 | 12.0 | 11.00 | 10th Cousins |
| 7 | 1 | 11.5 | 11.5 | 11.50 | 10th Cousins, Once Removed |
While the mean TMRCA The chart below illustrates the mean (adjusted to the nearest .5), the median (the midpoint TMRCA in the series), and the mode (most common TMRCA value). Where no green bar is present, there are multiple modes.
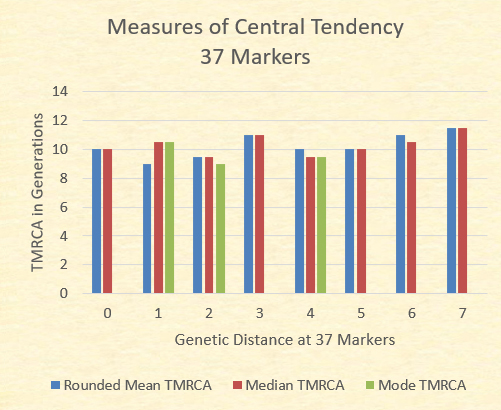
With the exception of the GD=7 where there is only one sample, the mean TMRCA, median TMRCA, and the modal TMRCA all fall within one generation of 10 generations.
The actual relationships and their genetic distances are better represented, however, on a scatter plot. Although there are 63 dots represented in the plot, there are 153 relationships.
The dots in the following graph often represent several distinct relationships at the same level and genetic distance. For example, the dot for a TMRCA of 14 generations (12C1R/13C) and a GD=0 represents 8 relational pairs; whereas the dot for siblings at a GD=0 represents only one relational pair. The trend line is close to the mid point of the results.
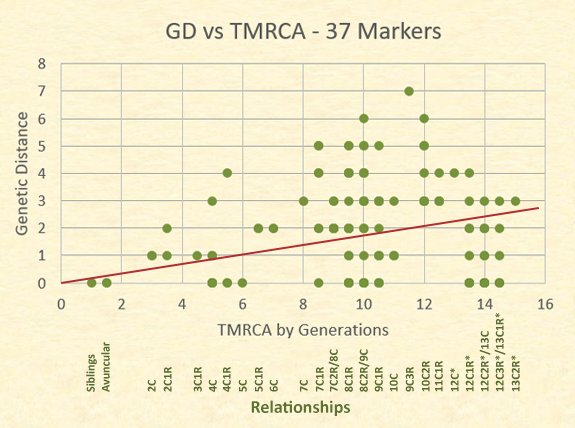
Notice the number of relationships showing a GD=0. Those at the highest relationship level are pairs of individuals who have a common ancestor born in the 1400s, and yet 16 of these distant cousins have a GD=0. More variability, however, is shown in the area of eighth cousins, twice removed and ninth cousins with a genetic distance range of 0 to 6.
Relationships with a GD of 5, 6, and 7 are indicative of each individual of the pair having more STR mutations from the modal haplotype than other typical participants. These differences often become wider at greater testing resolutions as illustrated below.
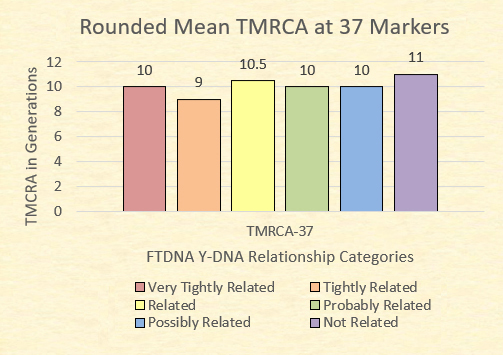
Finally, FTDNA categorizes relationships at 37 markers as being very tightly related (GD=0), tightly related (GD=1), related (GD=2 or 3), probably related (GD=4), possibly related (GD=5), and not related (GD=6+).
- one seventh cousin, once removed pair;
- one seventh cousin, twice removed pair;
- two eighth cousin, once removed pairs;
- one eighth cousin, twice removed pair;
- two ninth cousin pairs;
- one ninth cousin, once removed pair;
- one ninth cousin, thrice removed pair;
- and three tenth cousin, twice removed pairs.
43 MARKER ANALYSIS:
I questioned whether I should include the analysis at 43 markers, as no company is presently (to my knowledge) offering 43 (also marketed as 46) marker STR tests. I decided to include the results based on two reasons. First, the original 2014 post used 43 marker tests in its analysis. Second, adding the five participants increases the number of relationship analysis from 153 pairs to 253 pairs. The data for these additional 100 relational pairs could prove valuable; however, the overall analysis will concentrate on the 37 marker data.
The data for 43 markers uses similar tables and charts to those used in the 37 marker analysis.
| GD | n | MIN TMRCA | MAX TMRCA | MEAN TMRCA | ADJUSTED MEAN RELATIONSHIP |
| 0 | 67 | 0.5 | 14.5 | 8.84 | 8th Cousins |
| 1 | 38 | 2.5 | 15.0 | 11.24 | 10th Cousins |
| 2 | 78 | 5.0 | 15.5 | 10.85 | 10th Cousins |
| 3 | 41 | 6.0 | 15.0 | 10.54 | 9th Cousins, Once Removed |
| 4 | 17 | 7.5 | 15.0 | 11.71 | 10th Cousins, Once Removed |
| 5 | 10 | 8.0 | 13.5 | 10.25 | 9th Cousins, Once Removed |
| 6 | 2 | 9.5 | 14.0 | 11.75 | 11th Cousins |
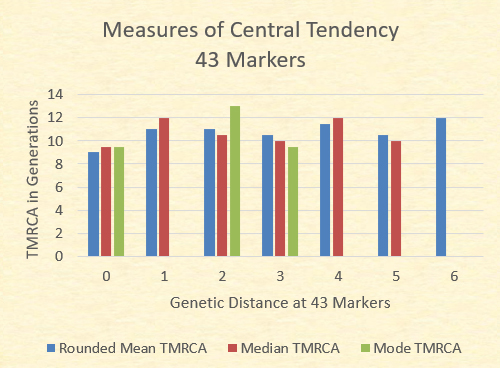
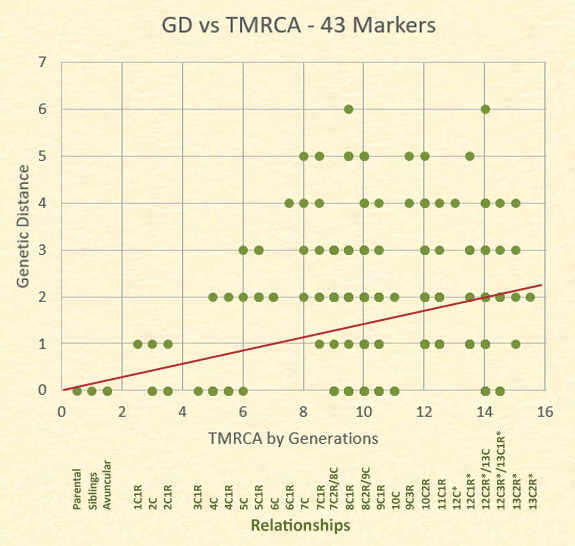
While the data presented at 43 markers is somewhat different, the results still indicate a great variety of relationships found at particular genetic distances. Although a perfect trend would be non-linear, the linear representation roughly indicates the middle of all the results. Remember, each dot can represent multiple relationships.
CONCLUSION:
The average results across the board are not significantly different. At a 37 marker resolution, a GD=0 and a GD=5 result in the same adjusted mean relationship: 9th cousins. The differences are found with the range of results. In our examples, a greater genetic distance indicates a narrower range of possible relationships. Therefore, it is unlikely that two people with a GD=4 are close relatives; however, a GD=0 could represent numerous relationships from very close relatives to those who are very distant, as a genetic distance of zero is all over the road.
In addition, matches with individuals of different surnames also create prediction problems. By analyzing the genetic distance, it is impossible to determine if any of these matches are related within the genealogical time period. In my own match list, I have 67 other surnamed individuals who match me at genetic distances of two, three, and four. Do any share an ancestor within the last 600 years and are a product of an ancestral NPE? Do they share an ancestor from the distant past and their results mimic close relationships due to convergence? At 37 markers alone, it is impossible to tell.
According our results, genetic distance at 37 markers is an insufficient predictor of relationship.
Although we have reached this conclusion, this is just one study and the results may only be indicative of this particular surname. I would be curious in knowing if others can replicate similar results in their studies.
While we may never know what causes the frequency of mutations on Short Tandem Repeats, the examination of studies where ancestries are documented may help us to better understand the role that genetic distance plays and to be able to better understand relationship prediction.
REFERENCE:
Canada, R.A. (2011). If two men share a surname, how should the genetic distance at 37 Y-Chromosome STR markers be interpreted? Family Tree DNA. https://www.familytreedna.com/learn/y-dna-testing/y-str/two-men-share-surname-genetic-distance-37-y-chromosome-str-markers-interpreted/
FTDNA ....YDNA .....same surname......0 distance at 25 markers (25-25)....1 distance at 37 markers (36-37).....after investigating these two men are from the same great great grandfather....to further the testing to hopefully get at a great grandfather, I have two living males, one from each side and want to know, am I better to test at a 67 or 37 marker and should it be on the 25 marker match or the 37 marker match ......trying to find my grandfather father, he was born out of wedlock and a very well hidden secret .....
ReplyDeleteI am a little confused by your question. Who are you testing?
Deletethe 37 marker ydna was tested on my first cousin, who was the nephew of my mother, who has a common father....he has since passed on but I can upgrade the test to 67 if that were a better test....I have test and communication with the 0 distant as well as 2 to 4 distance....I am trying to figure out which grandfather matches so then I may find the father of my maternal grandfather but that is very doubtful...any assistance from you would be greatly appreciated....my email is nana48.8142@gmail.com...Thank You !!!
DeleteNancy: Sorry. Blogger doesn't alert when I have comments. You would be better off looking at autosomal DNA to determine a grandfather. Find close matches to a number of people in your family. Y-DNA would not provide you the ability to discern who your grandfather might be other than his surname. As with the posts, there were several 12th cousins, once removed that matched at 37/37 or 43/43. The 67 resolution will help a little, but it is no magic bullet that will pinpoint a specific person.
DeleteI thoroughly enjoyed this post. Has there been an update?
ReplyDeleteThis comment has been removed by the author.
DeleteI found your post most interesting. I just want to verify that my understanding of DR is correct. If the GD between two individuals is 5, does that mean their relationship would be somewhere between 7th cousins, once removed, and 13th cousins, once removed? Thanks.
ReplyDeleteNo. What I am saying here is that it is impossible to pinpoint a relationship with Y-DNA STR matches. Close relatives could have more mismatches with you than a more distant person. Don't get boggled by the DR - it's only an illustration from my family.
DeleteNo. I think from memory reading a couple of years ago somewhere, where a GD of 5 was found between father and son, at 37 STR. So I would thake as is found in this post 5 and under could be related even closely, 7 and under related in last 12 generations maybe. Of course they may not be related at all, but a surname match and a locality match makes it likely. I cannot reall where I read this, I've also read of several at a GD of 4 at STR37 in close relatives.
DeleteThe 32/37 match of a father and son is quite unusual, and though it is valuable data, it may be an example of an outlier. A possible occurrence, but rare.
DeleteThanks for the post. That's illuminating indeed. But I'd like to understand what "once removed" means in geneological context.
ReplyDeleteOnce removed is where a cousin is from a different generation than you. For example, the child of your first cousin is your first cousin once removed. This person is your child's second cousin. I hope this helps.
DeleteThat's exactly what I was attempting to illustrate. Thanks for this additional information.
ReplyDeleteThis comment has been removed by the author.
ReplyDeleteMy views I have been trying to promote and add to other genetic researchers arsenal of ammunition are clearly reinforced by this study. I have read and read pages of posts in numerous FB pages and I still wonder....how do they come to these opinions when the answer is right in front of them in their Y-STR results. Mr Owstens study made me realize ...testers are making serious mistakes by making assumptions based on the TIP reports and the GD readouts from FTDNA. Another thing I finally got through my head...testers who ask on the different sites about their tests have no genealogy or very limited on their paternal line.These testers will not garner any evidence that will matter no matter how many tests they take or how many upgrades the y do. In the future as the SNP and Big Y program advances a look and match conclusion may be possible...but that future is far from now. This study combines Y-STR results and genealogy and the same as any study ....the results when adding genealogy,noting relevant mutations and what they imply give a much different picture than the predictions of the TIP and GD estimates.
ReplyDeleteThanks Michael for your astute observations on this matter. Trying to assess an unknown relationship with only STR markers and nothing else is a shot in the dark wearing a blindfold to boot.
DeleteJim, do you have any plans on conducting a study on the predictive value of the Big Y test in terms of genetic distance?
ReplyDeleteBest regards,
Mark Pallette
Mark: I'm not sure that can be done, but I will be writing something when the rest of my Big Y tests come in. I have been able to narrow two SNPs to specific people and one to within three generations. Of the two families noted above, they have unique SNPs downstream from the common one for everybody who has a Big Y. Some of YFull's TMRCA estimates are spot on, but others are off quite a bit. This may clear up once the new BAM files become available and are reloaded.
DeleteHave you found any Austins related to your Owstons?
ReplyDeleteDave: Only in as much as we had several Owstons closer in relationship to me who changed their name to Austin.
DeleteJim
ReplyDeleteI stumbled across these notes recently, and from the large number of individuals tested thought I might learn something by printing it out.
I feel compelled to make two points which I feel would enhance your whimsical study enormously:
With so much data, why not construct a DNA tree, consisting of deduced mutations occurring down separate sub-branches?
Take account of the fact that in small communities many of the NPEs arise npot only from different surnames, but the same surname linked with a more distant MRCA. These event will explain where you have a large genetic distance for close cousins etc. I'm surprised you don't mention that.
Mutations are the fundamental structure of a tree of descent, and FiT reports are simply based on the probabilities of actual mutations. A genetic distance does not mislead, but FTDNA should give the formulae they use. It can only be helpful if the markers involved are analysed wrt the various individuals. Consistency can be examined where genealogical infomation is available. Only extremely rarely will a marker (from 37 or more)have reverted, even where GDs of 6-7 exist. NPEs will be far more prevalent within your many samples, but you've not properly tried to build a genetic DNA tree that could expose that.
I recommend you tear up your notes and start to triangulate on the various markers. Your data must be a goldmine for that. I couldn't find any haplotypes in the article, but the answer to the title question is clearly a resounding NO - even without the gobledegook!
Mutation Man: I have actually constructed a genetic tree - but with actual documentation to chart the families. It is at http://www.owston.com/family/Owston/Owston_Tree.jpg
DeleteMost of the mutations tend to be singletons. I wrote about this in Advanced Genetic Genealogy: Techniques and Case Studies.
Of all our participants, only one back mutation has occurred and it is at 111. At 111, I have provided only the markers with mutations at http://owston.com/family/owston/STRmutations.jpg. The green are line specific, the red are parallel, the black are singletons, and the yellow is a back mutation. With a well documented family history that three of us have worked on since the 1970s, we don't have to rely upon creating a hypothetical genetic tree. In addition, the NPEs within our family are wildly different and not just a few markers beyond the modal haplotype. At the basic level, we are I1. We have men with our surname who are I2, R1b, R1a, G2a, and a couple from different I1 subclades. Our closes matches to the bulk of our participants are no closer than 2,000 ybp. The greater differences between our closely related members are just that and not a more distant TMRCA. Some members just have more mutations. I have a theory surrounding this based on geographical locations - those who stayed the longest in our ancestral region have more mutations - those who moved out before the industrial revolution generally have less mutations. I hope this helps.
As I have said elsewhere, thanks so much for this study - as more empirical evidence comes forward, year by year we will understand the importance of this discovery.
ReplyDeleteI have often wondered as well, have people taken into account that two people say back 9 generations be at GD-0 - simply because they mutated in parallel - rather than not at all.
And it is an all or nothing in that if mutations occur, you will be going the same or opposite direction on certain markers - so the issue really is that there is two to tango
So it could be mutation either way causing apparent stasis or accelerating.
In my work in the various FTDNA groups an admin or two will bring up this point almost in whisper - but methinks the power of the old orthodoxy is pretty strong - and like anything that relies on a strictly number crunching solution will never work - but retrenchment is the most heavy when the evidence against it is strong - a fact of life in general that forward thinking people always have to consider
Lloyd: Parallel mutations are possible and we have those in our family; however, all the men at a GD=0 all carry the modal haplotype. It is more likely that there may be mutations and back mutations, but I would be more inclined in thinking that there are no mutations at a GD=0 in our family at Y-37. At Y-111, we do have a back mutation that observed in my fourth cousin and he matches two men with the modal haplotype at a GD=0. We can only tell this by comparing others who are closely related to him (5th cousin and closer). He's the only one in our family group that does not have our line specific STR results.
Delete