Saturday, November 29, 2014

It's Just Another Brick from the Wall

 
Ask any genealogist to list his or her frustrations and inevitably the term “brick wall” will surface in the discussions.  Brick walls are points when all clues regarding an individual are seemingly non-existent.  In most cases, these brick walls occur as we go backwards in our lineage and we reach a point where an ancestor’s identity is unknown. 

For Americans, this can happen within a few generations as record keeping was sparse, spotty, or non-existent in some locales during the 19th century.  Municipalities, counties, and states had varying degrees of public record keeping. In other words, there is no official US standard and American genealogy can be difficult at best.  

When we begin our genealogical quest, our mission of discovering each ancestor is actually a series of brick walls that will be either knocked down with extensive research or will remain solid.  Sometimes this happens with one piece of direct evidence, or it only occurs with constant chiseling with indirect documentary or DNA evidence (see example).  Not only will we encounter brick walls while seeking our direct ancestors, but we will also run headlong into the same barriers when we trace the descendents of those ancestors as well – our collateral lines.

One of My Walls

For 37 years, I’ve been searching for my great-grandfather’s sister with very little luck.  Over time, I've been able to ascertain that Frances Jenett Owston was born in Allegheny City (now Pittsburgh’s North Side), Pennsylvania in 1852, but I never could find her as an adult.  I first became aware of her existence in early 1978 when my great-grandparents’ family bible surfaced after being out of the bloodline for nearly 50 years.  Between the pages of this large presentation bible was a piece of heavy paper stock with 11 locks of hair; each one was identified and dated. 

Some individuals had two samples from different periods of their lives including my great-grandfather who had one dated from 1858 when he was four years old and one from twenty-two years later.  While most of the names were easily identifiable as being members of my great-grandparents’ household, two were not.  One was a Grandma Ritchey, 70 years of age  – who was eventually determined to be my third great grandmother.  The other was for Fannie Owston; her sample was dated 1859. 

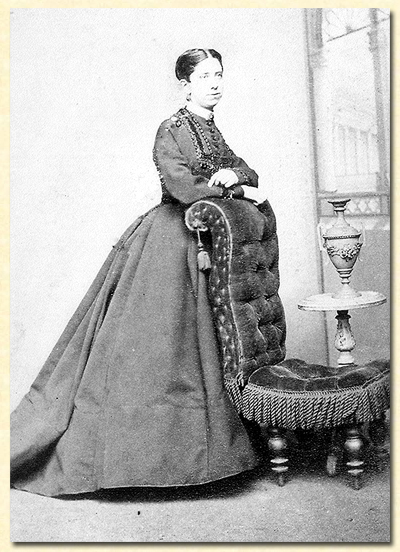
The other Fannie Owston - Frances W. Owston
For 27 years, I had assumed that this was my great-grandfather’s first cousin, Frances W. Owston, who also lived in Pittsburgh.  Since my great-grandfather’s family was musical and this Fannie Owston was a music teacher, it seemed plausible.  Confirming the identification was problematic, as I couldn’t initially find my second great-grandparents in the 1860 census.   Despite repeated searching of the census records, I was unable to find their listing until 2006. The problem was that the family was listed under an incorrect but similar surname and the head of the house’s (my second great-grandfather) initials were transposed.  See my post on this. 

Although finding the census in 2006 provided additional evidence of her existence as my great-grandfather’s sister, I was able to determine the identity of Fannie Owston four years earlier.  While browsing through the genealogical books in the Carnegie 
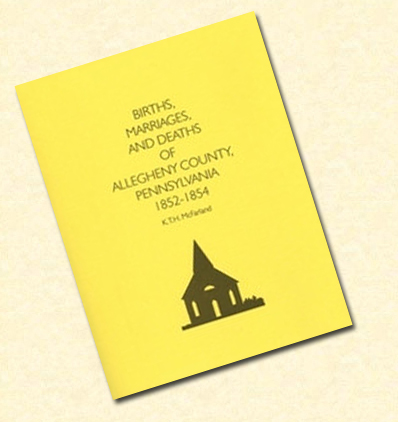
Public Library in Pittsburgh, I found Ken McFarland’s book Births, Marriages, and Deaths of Allegheny County, Pennsylvania 1852-1854.  McFarland’s a diligent researcher who has transcribed and indexed numerous records from the Greater Pittsburgh area.

While in 1980 I had previously looked at the microfilm of Allegheny County’s records from this period, I found no one in our family listed and never revisited these documents.  This time, however, I was interested in McFarland’s book, not for my own family, but for siblings of 1200 Pennsylvania Civil War soldiers that I am tracing from womb to the tomb.  I was hoping to find maiden names of the mothers of some of these soldiers. 

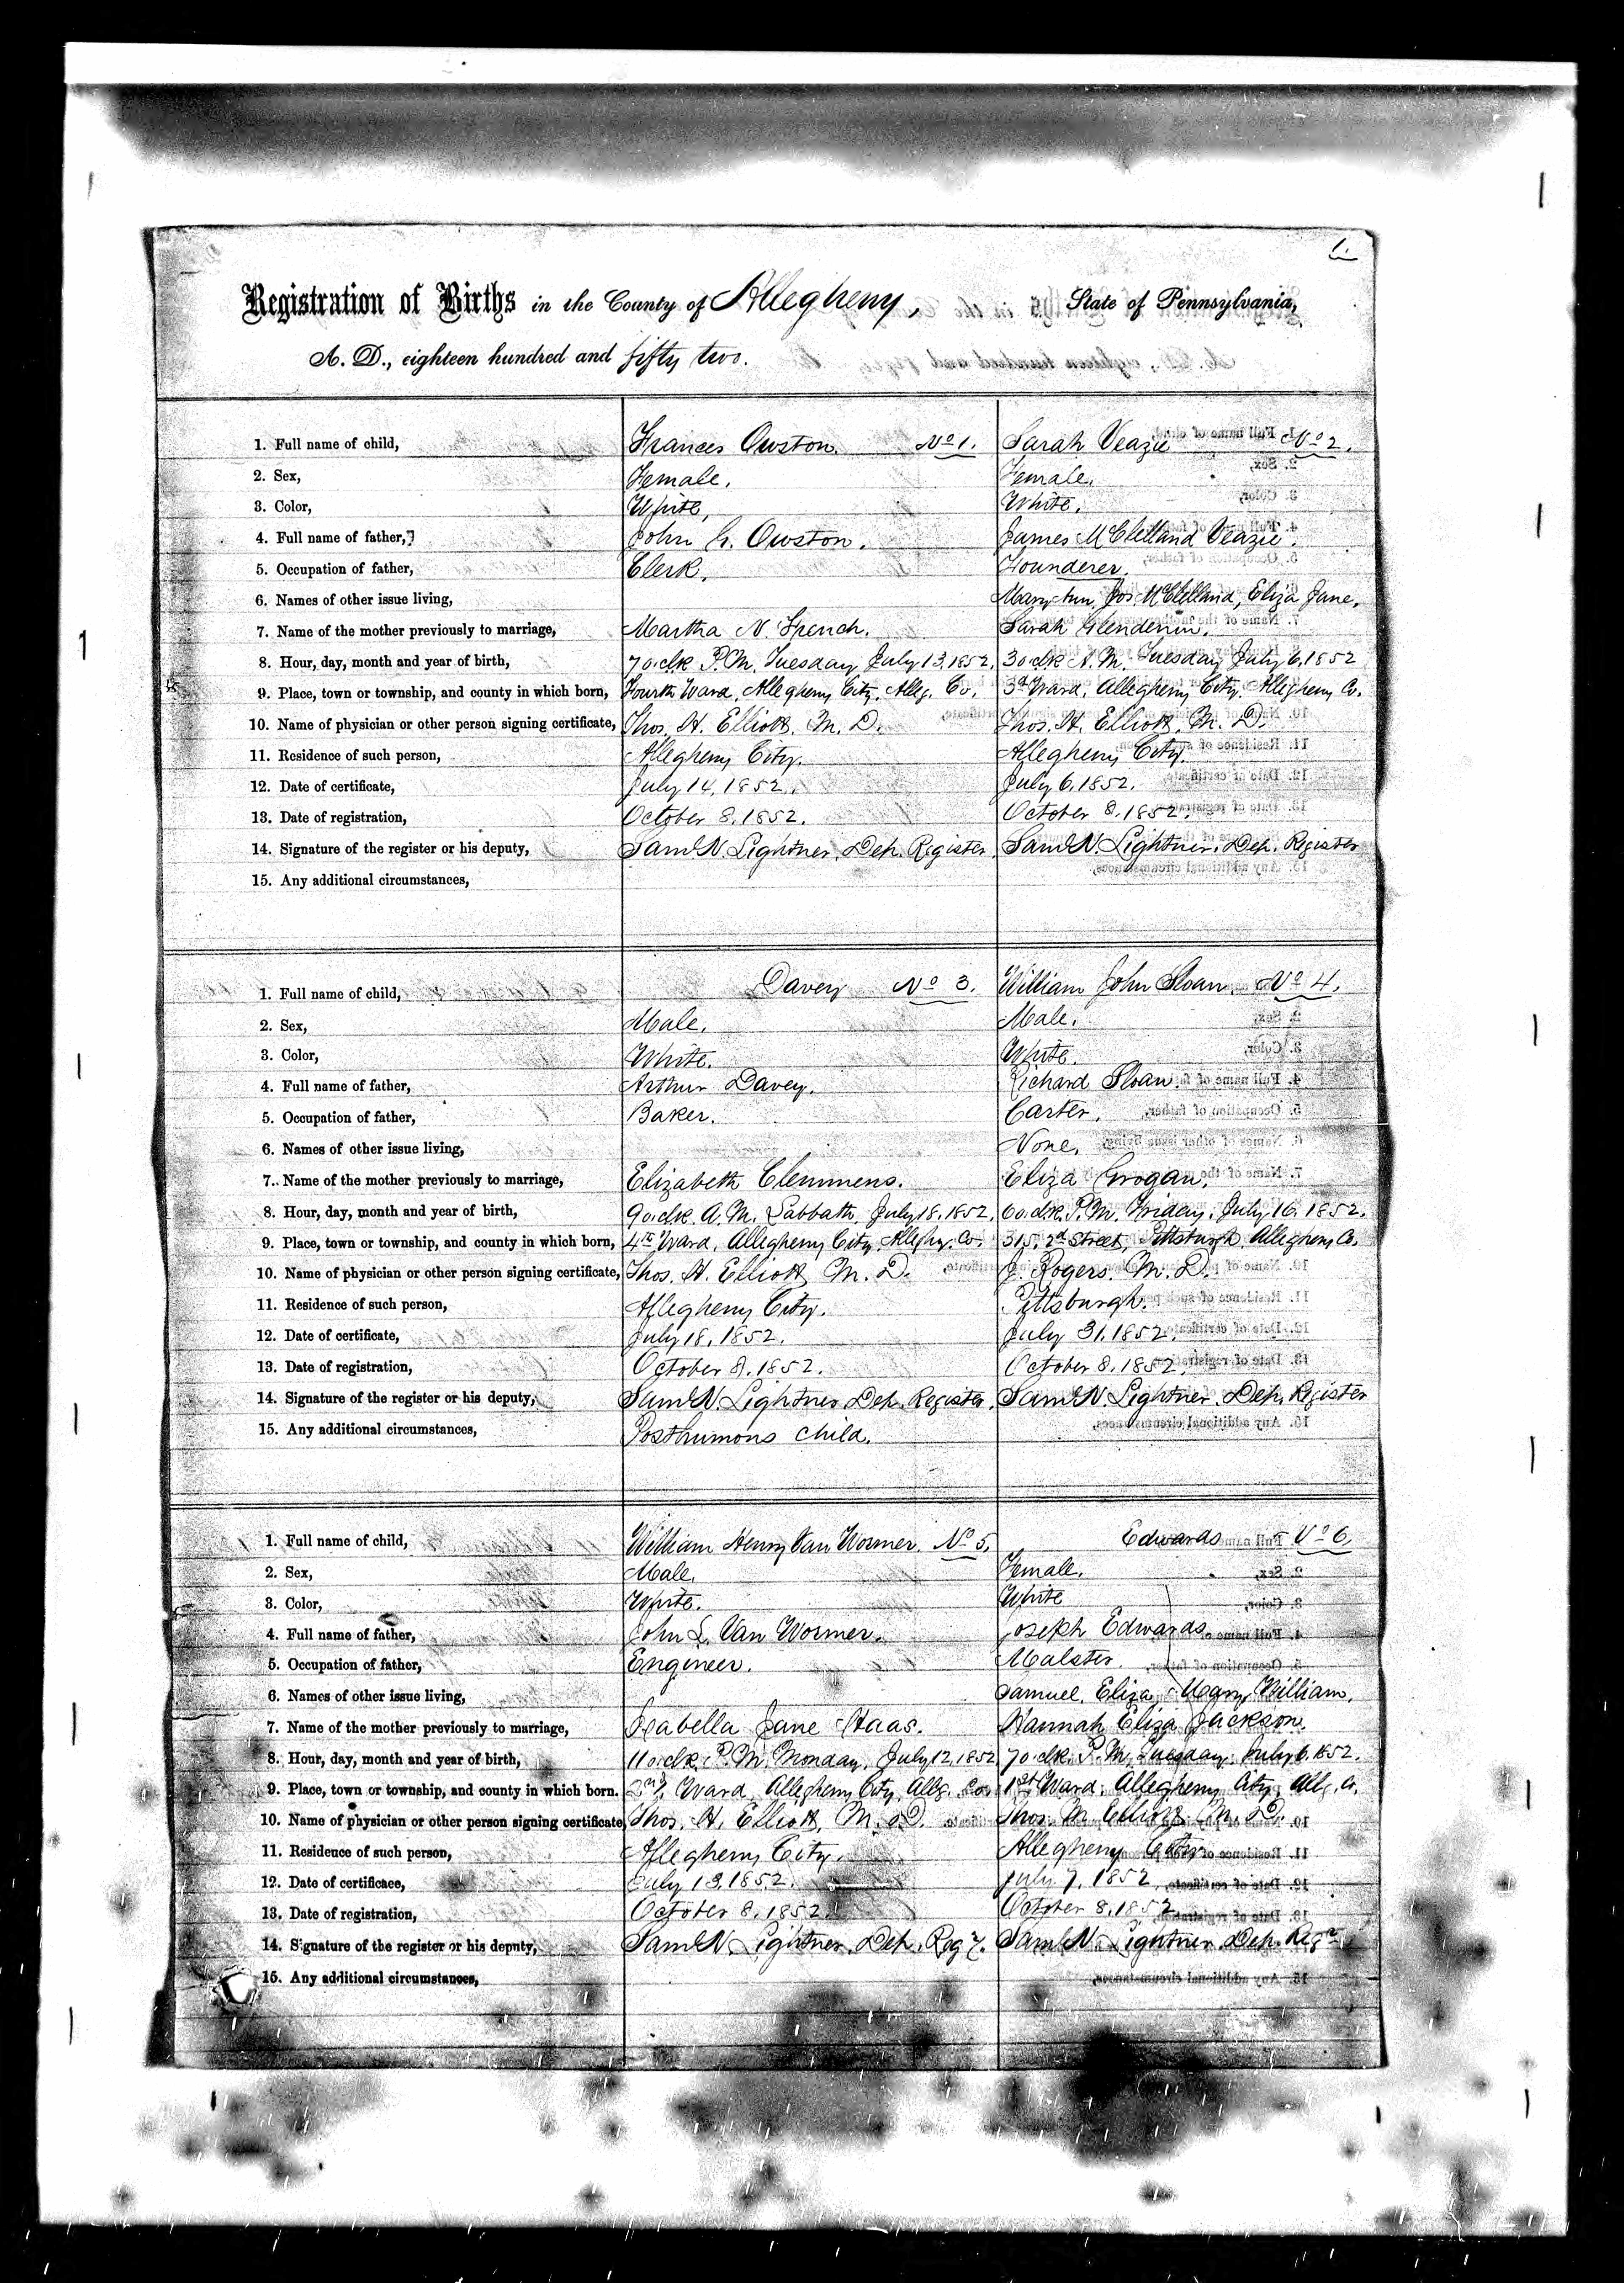
Click to see larger record.
As I opened the book, there it was on page one – and it was even registration number one: the birth record of Frances Owston daughter of John G. Owston and Martha N. French.  She was born at 7 PM on July 13, 1852 in the fourth ward of Allegheny City, PA.  Since this time, I’ve searched diligently for Frances Owston, but outside of the additional listing in the 1860 census, I’ve had no luck. 

The family had moved from Pittsburgh to Canada in about 1857 and was in Detroit in 1860 where my second great-grandmother died that same year.  In 1995, I had traveled to Detroit to research my second great grandparents.  While I found some information on the family, nothing on Frances surfaced.  No one else was buried in the plot where my second great grandmother was buried, so it seemed plausible that Fannie survived the family’s eight year stay in Michigan.

By 2009, I became aware of my family’s 1863 move from Detroit to East Saginaw along with my second great-grandfather’s marriage to and subsequent divorce from Permelia Condon.  This heretofore unknown tidbit was a serendipitous discovery through searching my surname in Google Books.  A published biography and photo of my second great-grandfather with information about his work in Saginaw led to the discovery of his second wife.  After the couple separated, the family moved back to Allegheny City in 1868. 

Unfortunately, Detroit, East Saginaw, and Wayne and Saginaw counties were not registering vital information during the 1860s and 1870s.  If Fannie had moved back to Allegheny County with her father and brother, chances of finding her if she married or died were marginal.  Allegheny County did not begin registrations of marriages until September 1885 and Allegheny City did not register births or deaths until July 1882. I had already checked all of these records in the past for anyone with my surname.  If death or marriage occurred before the 1880s, I might never find her.  But, I never stopped searching.

Background on the Records

While Pennsylvania is currently ranked at sixth in population, it was the second most populous state for much of its history.  You would think that a vital “keystone” of a state might have policies in place to register births, marriages, and deaths – but alas, it did not for many years.  In the mid 19th century, Pennsylvania attempted to institute registrations of births, marriages, and deaths.  This 1852 registration was unsuccessful, and the state dropped the experiment after two years.

One problem was that registration was not compulsory and many individuals failed to comply.  Frances Owston was the first to be registered in Pennsylvania’s second largest county and third largest city, but her birth occurred seven months after the law was effected and was not registered by the physician until three months later. Her brother’s birth two years later in the same town was never registered with the state.

Eventually, individual municipalities began to register births and deaths over the next 50 years.  Pittsburgh, the second largest city in the Commonwealth, began in 1870.  As previously stated, Pittsburgh’s neighbor to the north, Allegheny City, waited 12 more years to register birth and death records.  Other towns followed suit but only when it was convenient to do so. 

Additionally, none of these registrations through 1905 were mandatory.  A case in point is my father’s siblings. All five were born before 1906 and two died in early childhood during the same period; none of these events were registered even though the municipalities were actively registering births and deaths.   

The practice with marriages and divorces in Pennsylvania was different.  As of September 30, 1885, Pennsylvania required that all counties register marriages and these be on file in the local county courthouse.  Marriage registration was mandatory and the same process exists today.  Divorce records were registered with the county’s Prothonotary beginning in 1804.  Statewide mandatory vital registration, however, did not begin until 1906, which is late considering the population of Pennsylvania and that it prides itself on being the second state to ratify the Constitution.  

Fast forward

After November 2014’s election, Governor Tom Corbett may not think he has a friend in Pennsylvania, but he certainly has a friend in me, as he signed Act 110 (Pennsylvania Vital Records Bill SB-361) into law on December 15, 2011. I was one of the many people to sign several petitions over the last 10 years to hasten the Commonwealth to begin this process.  The bill went into effect on February 13, 2012 and the Division of Vital Records transferred all death certificates 50 years old and older and birth certificates 105 years old and older to the Pennsylvania State Archives in Harrisburg.  

Declaring these documents as old records made them easily available to the public and the old paper indexes for both became listed on the Pennsylvania Department of Health’s website.  The indices, however, are PDF scans of the typewritten copies and are laborious to use – but, at least, they are there. Copies of the original records are now available to anyone through the State Archives for $5.00.  This is providing you have the registration number from the indices.  From my personal experience, the turnaround of the processing takes less than a week.

How important is this move?  Being a native Pennsylvanian and an avid researcher of Pennsylvania records, this was a dream come true.  In the past, Vital Records’ processing was slow (up to a month); they could reject you if you were not a blood descendent or legal representative of the person on the birth certificate (a caveat on their forms); you were not allowed to copy, photograph, or publish an image of the record; and the service was expensive to use, especially if you simultaneously wanted numerous certificates. Prior to the transfer, a death record would cost $10, unless you didn’t know the date and then an additional search fee was of $10 was charged for a search of ten years.

While looking for my great-grandfather’s first cousin’s death record, I got stung for $50. Not knowing the date of his passing, I ordered a copy of the certificate with a 10 year window (1920-1929) search – that was $20. No document was found.  I ordered another search at $20 for the years of 1910-1919. This was also inconclusive.  Several years later while perusing a church’s records on site, I found his 1923 burial date – the cemetery provided an exact date of death.  I ordered the certificate again ($10) with the exact date and received it.  Unfortunately, Vital Records did a sloppy job on the first search and I was out $30. 

Further Movement

In August 2012, the Pennsylvania State Archives and Ancestry signed an agreement for the company to digitize and upload the records.  These would be freely available to Pennsylvania residents if they register at http://www.portal.state.pa.us/.  All Ancestry customers would also have access as part of their individual memberships. 

On April 18, 2014, Ancestry announced that it had uploaded the images and database information on death records from 1906-1924.  As with many individuals, I began searching for family and others.  As with the database and the certificates, there were some issues that I will address in future posts.  The second group, 1925-1944, went live on June 24, 2014.  The records through 1963 completed the death certificate process on October 24, 2014.

Birth certificates for 1906 will be completed in March 2015.  No timeline has been communicated regarding the records for 1907-1909.  Until the end of this year, only the indices for 1906-1908 are currently available. 

Brick Wall Smashed

In July 2014, I decided to see if Ancestry had completed any further uploading of death certificates.  They had, and I did my customary search of my surname.  To my surprise, I found a Frances Beecher Smith who was the daughter of John Owston and Martha French.  This was my great-grandfather’s missing sister.

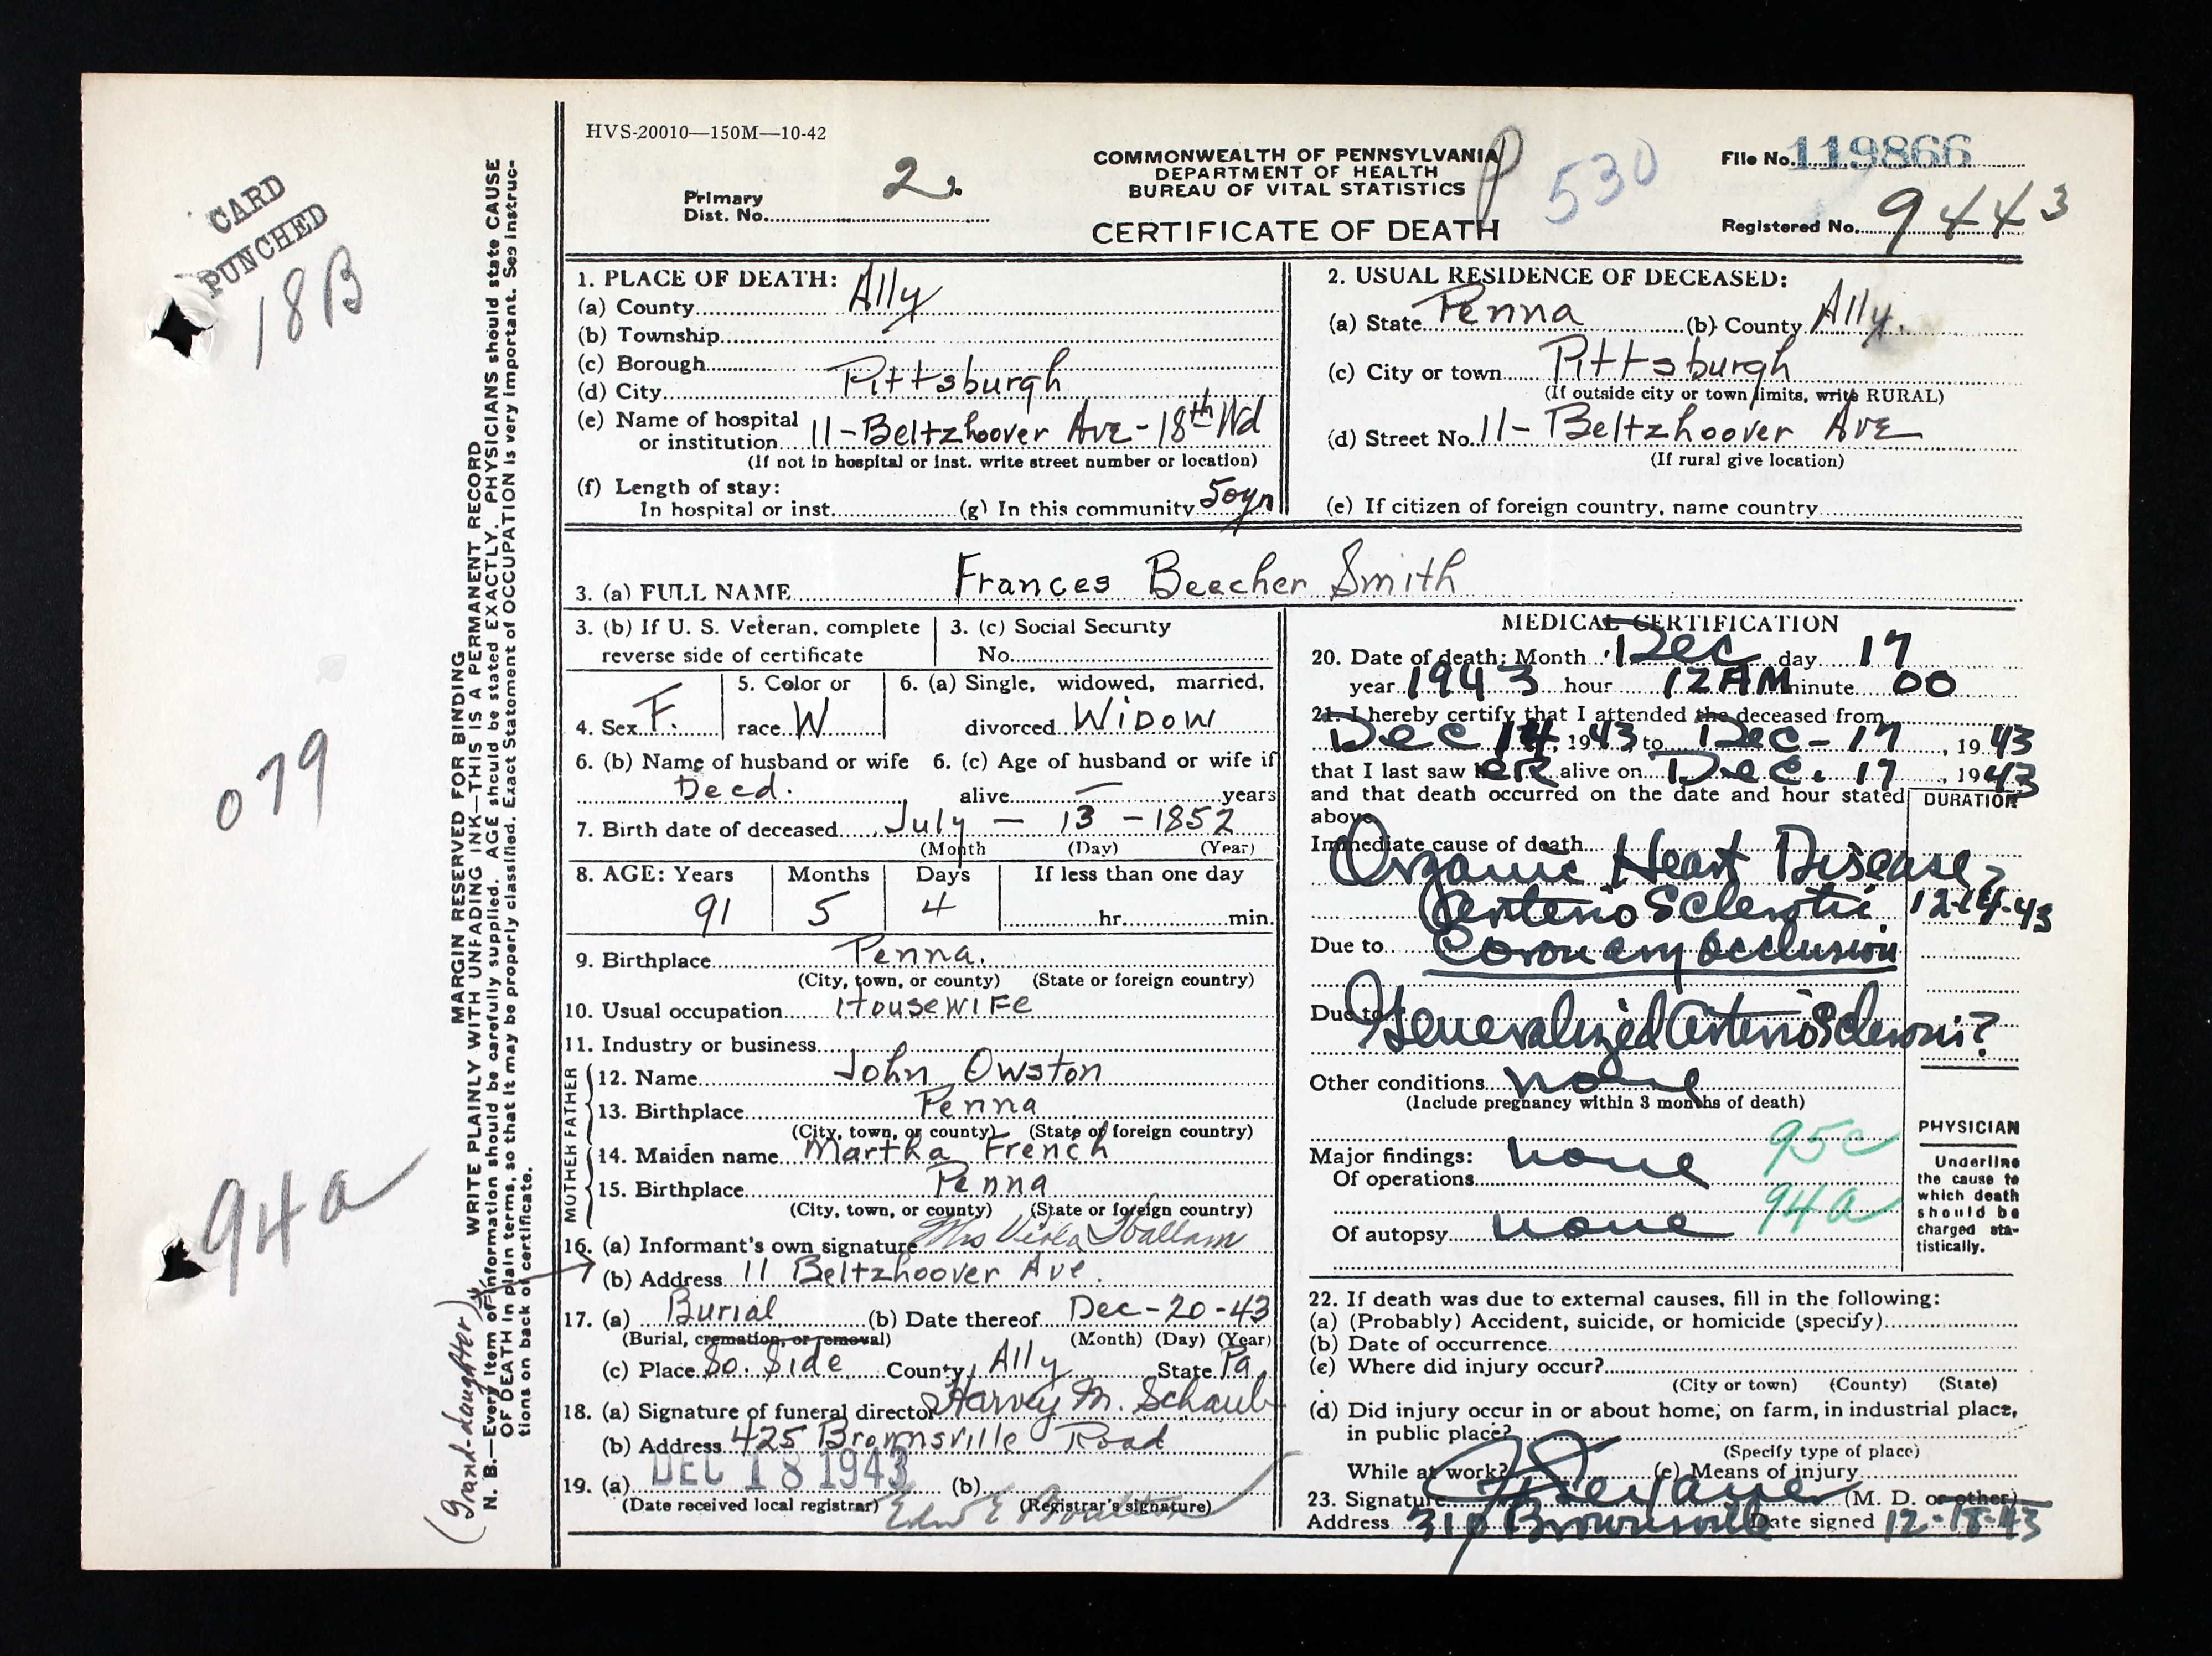
Click for larger version.
After doing additional research in Pittsburgh, I began to piece together her story:  two failed marriages, a bitter rivalry with another woman, the birth of two children, the loss of a grandchild, and the finding of another.  While she never owned her own home, what she did have was far more precious than gold.  She lived a long life and had the support of a family that dearly loved her and to whom she reciprocated that love.


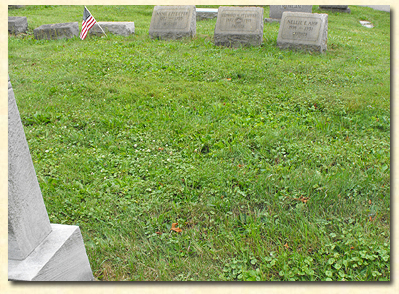
My biggest surprise about Fannie was that she lived less than 15 miles from my childhood home.  Outside of the records I previously mentioned, I had never encountered her in any other until now.  In fact, I had walked across her grave (which is unmarked) on at least four occasions looking for others in the same cemetery.   No stone is present, and even if there was one, I wouldn’t have recognized the name Frances Smith. 

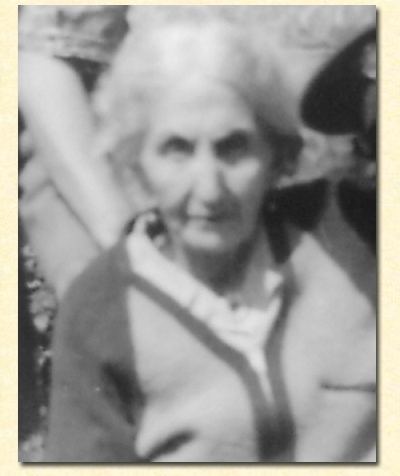
My brick wall - Frances J. Owston Beecher Smith
In addition, I have found Fannie’s only surviving great-grandchild who lived in the same home with her for two decades.   We have corresponded and talked on the phone concerning the differences and similarities in our respective families.  In addition, this third cousin turns out to be a double third cousin as I am related to both her maternal grandparents.  We still have a lot of catching up to do yet.

Thanks to the 48 members of the Pennsylvania Senate and 194 members of Pennsylvania House of Representatives who voted to pass this act, to Governor Tom Corbett who signed the bill into law, and to the forward thinking folks at the Pennsylvania State Archives and Ancestry for collaborating on this important project.

I have already viewed several hundreds of these certificates and in our next installment I will deal with death records, primarily those from Pennsylvania, and their importance as genealogical evidence and the inherent problems regarding these records as sources of information.  


References

Ancestry.com. (2014).  Pennsylvania, Births, 1852-1854. Database available at http://www.ancestry.com

Ancestry.com. (2014). Pennsylvania, Death Certificates, 1906-1963. Database available at http://www.ancestry.com

Gruber, T. (2014).  People for Better Pennsylvania Historical Records Access (PaHR-Access): Frequently Asked Questions.  http://users.rcn.com/pahraccess/PaHR-Access-FAQ.htm

Gruber, T. (2014).  People for Better Pennsylvania Historical Records Access (PaHR-Access): Genealogists, Researchers, Family Historians.  http://users.rcn.com/pahraccess/PaHR-Access.htm

McFarland, K.T.H. (1999). Births, Marriages, and Deaths of Allegheny County, Pennsylvania 1852-1854. Apollo, PA: Closson Press.

Pennsylvania Department of Health. (2014). Act 110 – Public Records (formerly known as Senate Bill 361). http://www.portal.state.pa.us/portal/server.pt/community/public_records/20686

Pennsylvania General Assembly. (2012). Senate Bill 361; Session 2011-2012.  http://www.legis.state.pa.us/cfdocs/billinfo/bill_history.cfm?syear=2011&sind=0&body=S&type=B&bn=361

Pennsylvania Historical & Museum Commission. (2014). Vital Statistics Records at the Pennsylvania State Archives.  http://www.portal.state.pa.us/portal/server.pt/community/genealogy/3183/vital_statistics/387291

Thursday, June 19, 2014

Is Genetic Distance an Adequate Predictor of Relationships?


On January 23, 2018, this June 19, 2014 post was reconstructed due to new information about the families discussed herein.  When it was originally published, our three surname researchers had been under the estimation for nearly three decades that the Owston family from Ganton in the original East Riding of Yorkshire was originally descended from Giles Owston (d. 1641) and his progeny who lived in this same parish from the 16th through the 18th centuries.

However, recently released Big Y results and a reexamination of the records of three parishes indicate that the current Ganton Owstons are actually a branch of the Sherburn family and not a distinct family at all. This was something that was not overtly evident in the original records and could not be determined with either STR or autosomal DNA testing.

While the new data places these participants at a closer relationship level than originally thought, it does not conflict with our original premise from 2014. In addition, more recent results are used in this update, as we are able to move the comparison from 59 to 253 relationships.

INTRODUCTION:
While obviously having a small pool of potential Y-DNA participants, low frequency surnames may have the advantage of having good documentation of ancestry. That is the case with my surname and its corresponding Y-DNA Project. The original intent of our project was to see if three families (at the time) bearing our surname from the original East Riding of Yorkshire had a common ancestry or if the surname was applied to these lineages independently from each other. Since the original writing, the number of distinct families has been reduced from three to two.

The two extant families are as follows:
SHERBURN: The largest Owston family hails originally from Sherburn in Harford Lythe and its many members descend from Peter Owston who died in 1568. This group also includes the Ouston descendants of James Ouston (1711-1785) who was born in Brompton by Sawdon and who died in Sigglesthorne. You’ll find members of this clan in the UK, Australia, USA, Canada, New Zealand, Nicaragua, and Italy. Ninety-one percent (yes, we counted) of all Owston and Ouston males descend from the Sherburn family. 
THORNHOLME: The second group of Owstons from 15 miles south of Sherburn and Ganton can be traced to Richard Owston of the village of Thornholme in the parish of Burton Agnes. Richard Owston died in 1739. By using onomastic evidence, it is possible to theorize a connection to an earlier Ganton line fathered by Robert Owston who was born in the 16th century. The names Richard, Michael, and Matthew appear both in the later Thornholme family as well as in the extinct Robert Owston of Ganton family. The Thornholme Owstons  are found in Canada, Australia, the UK, Finland, and New Zealand. Only 25 males descend from the smaller Thornholme family.

In the study’s first year, a positive conclusion was reached; as three participants (one from each identified family at the time) matched each other at 100% using 43 Y-DNA marker tests from GeneTree. Others in the study matched at a genetic distance of 2 and 3.

This was exciting news, as it was impossible to determine a relationship between these lineages, as the connection between these families apparently occurred before the introduction of English parish registers in 1538.

The first record of the surname in the region (spelled as Oustyn) appeared in a 1452 will from the parish of Wintringham. By the 16th century, the surname began to ramify within a five mile radius of Ganton and was found in Ganton, Staxton in Willerby, Sherburn, Foxholes, and West Heslerton - all presently in the Ryedale District of North Yorkshire.

GROWTH OF THE PROJECT:
In order to better understand our relationships and to construct a more conclusive modal haplotype of the Owston families, it was necessary to branch out beyond our original participants and attempt to test as many Owston/Ouston males as possible. We have identified 23 lines from the two families. Some lines can further be subdivided into groups that we call segments. Currently, there are 37 segments and unsegmented lines.

As of 2018, the Owston/Ouston DNA project has 33 Y-DNA participants – 28 Sherburn family members and 5 Thornholme participants. The participants represent at least one person from 20 of the 23 lines and 26 of the 37 lines and segments.  Additionally, some lines/segments have more than one participant. All five Thornholme lines are represented. For a look at the charts, see http://www.owston.com/family/owston/Owston_Family_Charts.pdf.

Of the 33 participants, one individual is awaiting awaiting test results. Nine of the remaining individuals failed to match the modal haplotype and are apparently the results of non paternal events (NPEs). Several of these participants descended from families where known NPEs existed, while others’ results were a complete surprise. It is to be noted that everyone who tested had a clear paper genealogical line to one of the two original families. It is estimated that one-third of Owston/Ouston males have an ancestral NPE; this number may be even greater.

GENETIC DISTANCE:
Currently, 23 of the participants have a solid match to the modal haplotype. These represent three Thornholme participants and 20 Sherburn participants. Early in this study, we noticed that some individuals were inclined to have closer genetic matches with participants who were genealogically more distant than those who were more closely related. This was a curiosity that led to the eventual writing of this post and the raising of 18 participants' STR resolutions to 111 markers.  It also influenced our testing of 15 participants with FTDNA's Big Y test (3 tests are currently pending).

Over the years, genetic genealogists have tended to rely upon genetic distance to help predict a range of possible relationships. In fact, FTDNA qualifies matches at various levels of genetic distance.

For example, FTDNA states that a GD=0 at 37 markers indicates that the two individuals are “very tightly related”; and with a confidence level of .05 or less, FTDNA estimates that these individuals are related within eight generations (seventh cousins). A mismatch of one GD is considered “tightly related.” Genetic distances at 2 or 3 marker differences between men of the same surname are identified as “related.” As GD increases, the likelihood of a relationship diminishes with a GD=6 as considered as being not related, even when the same surname is present (Canada, 2011).

In addition, most of us have genetically close matches with individuals who obviously are further back on the relationship continuum and do not share a common surname or variant. At 37 markers, I have a number of matches with individuals whose ancestry hails from distances far removed from my own East Riding ancestors. While we are related, the connection is likely before the genealogical time frame and may be prior to the various invasions of Britain – one of which brought my ancestors from mainland Europe.

Using my project as a case study, I have hypothesized that, although a predictor of a familial connection, genetic distance is an inadequate predictor of relationships. Before I discuss my results, I must present some caveats.

First of all, I cannot confirm the exact connection between the two families in my study; however, I have constructed plausible trees based on shared forenames, typical naming conventions, names found in wills and other local records, and the close geographical distances among both current families and three earlier extinct families. Currently, we can only affirm the relationship intra-family; however, based on the aforementioned factors, we are confident that the supposed relationships are close to the unknown actual relationships. The closest possible relationships are used in this analysis and should be no more distant than two generations, but due to different downstream SNP markers, the relationships are not any closer.

Secondly, not all 23 matching participants tested at the same level of resolution. Five participants tested only at 43 markers at the now defunct GeneTree. Two of these men are deceased.  We have been attempting to get the remaining three to upgrade at Family Tree DNA. Hopefully, at least two key participants will agree to a retest in 2018. One is critical as he is the last male in his line. We were successful in 2016 in retesting the last male in another line, as he died in late 2017.


In the original post, we compared all 37 marker tests to each other and all 43 marker tests to each other.  The original combined analysis had only 59 compared relationships.  In this new analysis, we compare 153 relationships at 37 markers and 253 at 43 markers.  We only include the 43 marker results in order to use the data from the five participants who have only tested at 43 markers. These five can be compared to the 18 participants who have tested at 111 markers, as the additional markers at 43 are found within FTDNA's 111 STR markers.

Third, there were only five participants with close relationships (fifth cousins and closer) in the original analysis; therefore, the mean TMRCA (time to the most recent common ancestor) skewed more distant. We now have 26 relationships at the fifth cousin level or closer.

The relationships are as follows:

RelationshipsNumber
  Father/Son1
  Brothers1
  Uncle/Nephew2
  1st Cousins, Once Removed1
  2nd Cousins3
  2nd Cousins, Once Removed3
  3rd Cousins, Once Removed1
  4th Cousins7
  4th Cousins, Once Removed4
  5th Cousins3
  5th Cousins, Once Removed5
  6th Cousins2
  6th Cousins, Once Removed1
  7th Cousins4
  7th Cousins, Once Removed6
  7th Cousins, Twice Removed1
  8th Cousins23
  8th Cousins, Once Removed29
  8th Cousins, Twice Removed4
  9th Cousins30
  9th Cousins, Once Removed21
  9th Cousins, Thrice Removed2
10th Cousins4
10th Cousins, Twice Removed24
11th Cousins, Once Removed10
12th Cousins*1
12th Cousins, Once Removed*14
12th Cousins, Twice Removed*5
12th Cousins, Thrice Removed*1
13th Cousins*24
13th Cousins, Once Removed*10
13th Cousins, Twice Removed*5
13th Cousins, Thrice Removed*1
*The exact relationships between members of the Sherburn and Thornholme families are not presently known. These relationships are estimated through onomastic evidence and references in wills; the assumed relationships are listed at the closest possible level; however, they may be one or two more generations further distant, but not any closer, as the families have distinct SNP signatures beyond their common I-A10206 SNP.     
The genetic distance of the 153 relationships at 37 markers ranges from 0 to 7, while the 253 relationships at 43 markers have a genetic distance range from 0 to 6.

A relationship listed with a .5 value (i.e., 1.5, 5.5, 14.5) indicates that the two parties are from different generations.  For instance, 9th cousins, once removed are categorized as having at TMRCA of 10.5 generations.  One member of the pair has a TMRCA of 10 generations, while the other individual has a TMRCA of 11 generations. The compromise is 10.5 generations for the relationship's common ancestor. 

37 MARKER ANALYSIS:
Often considered a baseline reliable STR resolution, the 37 marker test from FTDNA is generally considered the entry point for many Y-DNA participants.  Of our 153 relationships at this resolution, the following chart illustrates the range of time to the most recent common ancestors (TMRCA) and the mean (mathematical average). Finally, the mean is rounded to the nearest .5 to determine the adjusted mean relationships. 

GDnMIN
TMRCA
MAX
TMRCA
MEAN
TMRCA
ADJUSTED MEAN 
RELATIONSHIP
046  1.014.5  9.90  9th Cousins
120  3.014.5  9.20  8th Cousins
231  3.514.5  9.69  8th Cousins, Once Removed
328  5.015.011.1110th Cousins
416  5.513.510.06  9th Cousins
5  9  8.512.010.06  9th Cousins
6  210.012.011.0010th Cousins
7  111.511.511.5010th Cousins, Once Removed

While the mean TMRCA The chart below illustrates the mean (adjusted to the nearest .5), the median (the midpoint TMRCA in the series), and the mode (most common TMRCA value). Where no green bar is present, there are multiple modes.


With the exception of the GD=7 where there is only one sample, the mean TMRCA, median TMRCA, and the modal TMRCA all fall within one generation of 10 generations.

The actual relationships and their genetic distances are better represented, however, on a scatter plot. Although there are 63 dots represented in the plot, there are 153 relationships.

The dots in the following graph often represent several distinct relationships at the same level and genetic distance. For example, the dot for a TMRCA of 14 generations (12C1R/13C) and a GD=0 represents 8 relational pairs; whereas the dot for siblings at a GD=0 represents only one relational pair. The trend line is close to the mid point of the results. 


Notice the number of relationships showing a GD=0. Those at the highest relationship level are pairs of individuals who have a common ancestor born in the 1400s, and yet 16 of these distant cousins have a GD=0. More variability, however, is shown in the area of eighth cousins, twice removed and ninth cousins with a genetic distance range of 0 to 6.

Relationships with a GD of 5, 6, and 7 are indicative of each individual of the pair having more STR mutations from the modal haplotype than other typical participants. These differences often become wider at greater testing resolutions as illustrated below.

Although bearing their own designations, both the Cobourg (named for a Canadian town) and the Ganton families are subsets of the Sherburn family.

Finally, FTDNA categorizes relationships at 37 markers as being very tightly related (GD=0), tightly related (GD=1), related (GD=2 or 3), probably related (GD=4), possibly related (GD=5), and not related (GD=6+).

Note, FTDNA will only show matches with a genetic distance of four or less. Twelve relationships do not show as matching at 37 markers. These relationship pairs are as follows:

  • one seventh cousin, once removed pair; 
  • one seventh cousin, twice removed pair; 
  • two eighth cousin, once removed pairs; 
  • one eighth cousin, twice removed pair; 
  • two ninth cousin pairs; 
  • one ninth cousin, once removed pair; 
  • one ninth cousin, thrice removed pair; 
  • and three tenth cousin, twice removed pairs. 

43 MARKER ANALYSIS:
I questioned whether I should include the analysis at 43 markers, as no company is presently (to my knowledge) offering 43 (also marketed as 46) marker STR tests.  I decided to include the results based on two reasons.  First, the original 2014 post used 43 marker tests in its analysis.  Second, adding the five participants increases the number of relationship analysis from 153 pairs to 253 pairs. The data for these additional 100 relational pairs could prove valuable; however, the overall analysis will concentrate on the 37 marker data.

The data for 43 markers uses similar tables and charts to those used in the 37 marker analysis.   


GDnMIN
TMRCA
MAX
TMRCA
MEAN
TMRCA
ADJUSTED MEAN 
RELATIONSHIP
0670.514.5  8.84  8th Cousins
1382.515.011.2410th Cousins
2785.015.510.8510th Cousins
3416.015.010.54  9th Cousins, Once Removed
4177.515.011.7110th Cousins, Once Removed
5108.013.510.25  9th Cousins, Once Removed
6  29.514.011.7511th Cousins


While the data presented at 43 markers is somewhat different, the results still indicate a great variety of relationships found at particular genetic distances.  Although a perfect trend would be non-linear, the linear representation roughly indicates the middle of all the results. Remember, each dot can represent multiple relationships.

CONCLUSION:
The average results across the board are not significantly different. At a 37 marker resolution, a GD=0 and a GD=5 result in the same adjusted mean relationship: 9th cousins. The differences are found with the range of results.  In our examples, a greater genetic distance indicates a narrower range of possible relationships. Therefore, it is unlikely that two people with a GD=4 are close relatives; however, a GD=0 could represent numerous relationships from very close relatives to those who are very distant, as a genetic distance of zero is all over the road.

In addition, matches with individuals of different surnames also create prediction problems. By analyzing the genetic distance, it is impossible to determine if any of these matches are related within the genealogical time period. In my own match list, I have 67 other surnamed individuals who match me at genetic distances of two, three, and four. Do any share an ancestor within the last 600 years and are a product of an ancestral NPE?  Do they share an ancestor from the distant past and their results mimic close relationships due to convergence? At 37 markers alone, it is impossible to tell.   

According our results, genetic distance at 37 markers is an insufficient predictor of relationship.

Although we have reached this conclusion, this is just one study and the results may only be indicative of this particular surname. I would be curious in knowing if others can replicate similar results in their studies.

While we may never know what causes the frequency of mutations on Short Tandem Repeats, the examination of studies where ancestries are documented may help us to better understand the role that genetic distance plays and to be able to better understand relationship prediction.

REFERENCE:
Canada, R.A. (2011). If two men share a surname, how should the genetic distance at 37 Y-Chromosome STR markers be interpreted? Family Tree DNA. https://www.familytreedna.com/learn/y-dna-testing/y-str/two-men-share-surname-genetic-distance-37-y-chromosome-str-markers-interpreted/