Saturday, December 1, 2018

Understanding FTDNA's New Big Y-500 Differences Column


During this past week, Family Tree DNA has added a column to the Y-DNA Matches feature called “Big Y-500 STR Differences.”  There has been much said about this column, and there is a great deal of confusion as to what it means. I’ve seen a few argue a point that is different than the one I espouse. Hopefully, by the end of this post, we can agree on this new set of data.  

Background

The Owston/Ouston DNA project has a total of 33 Y-DNA participants with 16 having taken a Big Y-500 test. The Big Y-500 participants range in relationship of a second cousin pair to an estimated 13th cousin, twice removed pair. Most relationships fall between eighth cousins and ninth cousins, once removed.  Our family charts can be found at http://www.owston.com/family/owston/Owston_Family_Charts.pdf.

A truncated version of my personal Y-111 report with Big Y-500 data appears below and shows the genetic distance at 111 markers.  I have removed all duplicate information and personal identifications. 


The STR Differences Column

The Big Y-500 STR Differences column is spurring all the recent interest. The higher number is obviously the number of markers beyond 111 that can be compared. These are the markers where neither compared participant has a no-call.  It is the smaller number, however, that is generating a bit of disagreement.

Some believe this smaller number is the genetic distance for the markers beyond 111; however, it is not. When looking at the raw data for all matches in a project, one can deduce that this number is not the genetic distance. 

The belief that this is genetic distance is because the number will mimic the infinite alleles model when there is only a one-step difference per mismatched marker. This is what is causing the confusion. Just because it looks like a duck and waddles like a duck, it might be a goose.

What is it then?  The column simply gives the user the opportunity to see how many of the comparable markers (the larger number) and the number of those markers that differ (the smaller number). 

When I compare the actual genetic distance with the number in the Big Y-500 STR Differences column for all 120 relationships, only 52 have the same number for genetic distance beyond Y-111 and for the Big Y-500 STR Differences.  The remaining 68 (56.7%) have larger numbers. 

I have provided the data in a PDF file on my website. The rows in lavender are those where the post 111 marker genetic distances and the STR differences columns do not match.

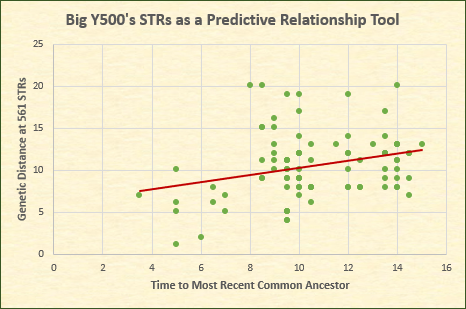
What about Genetic Distance?

When combining the genetic distance from both sets of markers (Y-111 and the 112-561), the results are all over the road.  I’ve seen this at 37, 67, and 111 markers as well. The greatest GD for both markers occurs for a pair of seventh cousins and a pair of eighth cousins. Both pairs exhibit a GD of 21. A GD of 8 has a relationship range of second cousins, once removed to thirteenth cousins, once removed and everything in between.  Genetic Distance is a poor indicator of relationship, as mutations occur randomly.

Compared Numbers

As far as the compared markers (larger number in this column), our project has a range of 364 (ninth cousins) to two pairs with 444 (8C1R and an estimated 13C1R) for the possible 450 additional markers. The mean number of usable markers is 418, while the median is 427 and the mode is 435.

The Overall Importance of this Data

How important is this data? This remains for you to discover in your own family project. As for me, the additional STRs have not provided much additional detail for our family. Of all the additional 450 markers, only three are line specific. 

DYS631=11 (modal 10) is indicative of the Cobourg line; however, so is DYS643=11 (modal 10) found in the first 111, as well as the A10921 and A10923 SNPs.  

FTY510=10 (modal 9) is a signature marker for the Thornholme family, but so is DYS481=25 (modal 26) found in the first 67 markers, as well as the I-A15739 and I-A15740 SNPs. 

DYS489=13 (modal 12) is probably the most valuable of the three, as it is a defining STR marker for the Ganton Branch. While there are two line specific markers for the Rillington Builders Line in the first 111, there is no other Ganton Branch specific STRs besides DYS489. The Ganton Branch is also identified by the I-A10208 SNP.   

Of the 450 markers, 147 exhibit no-calls. There are 260 no-calls in total in our project. Twenty-four of the markers have at least one mutation present. Sixteen only exhibit one person experiencing a mutation among the markers’ results. 

The Real Value of the Big Y-500

As I said earlier in the year, the greater value in the Big Y-500 are the SNPs. For our family, the Big Y-500 cleared up three issues:

  • It provided additional evidence that a spurious male was descended from a specific progenitor.
  • It allowed us to determine which of two men with the same name was the ancestral father for a line of descent.
  • It aided in correcting a mistake in our own genealogical research that occurred thirty years ago. It helped us revisit the documentation of a family in question, and in doing so, this documentation provided the same answers as were found among four matching SNPs.
My experiences may be different than yours and I am hoping that you will find the additional STRs helpful. Remember, the Big Y-500 STR Differences column is not a record of genetic distance, but it is rather a number of markers where a mismatch occurs. 


Addendum


I was alerted by a reader that Family Tree DNA had already posted an explanation of this column.  Their explanation, which agrees with the above, is found below: 


"In the matches section, the Big Y-500 STR Differences column is now displayed between Genetic Distance and Name columns.
Understanding the Big Y-500 STR Differences Column This column displays the mismatch number and the number of comparable Big Y-500 STR markers between the kit and a match.
Let us say that for a match 2 of 395 is displayed in this column:
• 395 is the number of comparable markers between the kit and the match. In other words, both the kit and the match have STR values on 395 of the same Big Y-500 STRs. Note: On the CSV file, this value is displayed in the Big Y-500 STRs Compared column.
• 2 is the mismatch number. In other words, out of the 395 Big Y-500 STRs on which the kit and the match have values, there are 2 markers for which the kit and the match has a different value. Note: On the CSV file, this value is displayed in the Big Y-500 STR Differences column."


Saturday, April 21, 2018

Does the Big Y500 Provide Value?


Along with most of the genetic genealogical world, I discovered Friday that Family Tree DNA had added 450 new Short Tandem Repeat markers (STRs) to our project's Big Y accounts. It was fascinating to look at these markers within my surname project and to try and understand if these results provided any real value. Currently, we have 14 Big Y accounts that are spread across numerous lines and branches of the Owston/ Ouston family that originated in the Ryedale District of what is now North Yorkshire.  You can access the project's charts at Owston.com.

One of the issues with the additional 450 markers is the predominance of no-calls that occurred in the data. In our project, the no-calls varied in number by individual and they ranged from 3 to 35 per person with the average being 11.07. If I remove the outliers of 20 and 35, the average drops to 8.3 no-calls per person. A total of 155 no-calls were reported from 7,854 cumulative markers. This represented 1.97% of the whole. This percentage is less than the reported no calls found in YFull’s analysis of the Big Y’s STR data.

A second issue resolves around the naming of these markers, as it appears that FTDNA has placed proprietary names on many of the markers in Panel 6 (112-561). This makes it difficult to compare with YFull results. Where the naming convention is the same designation as used by YFull, the numbers do not always agree. This is probably based on FTDNA’s counting of the repeats. This was something that those of us who transferred Y-33 and Y-46 results from Ancestry, GeneTree, and other companies to FTDNA had experienced in the past. The same situation may apply here.

Third, several folks on various Facebook groups have noticed that numerous low values appear in the results. This may indicate a lack of variability across participants. The lowest marker value in our project was “4” with 116 modal results. Five repeats also occurred 116 times as the modal value and “6” appeared 65 times. With the new 450 markers, double digit values appeared 69 times as the modal result.

Fourth, while we have not tested many individuals from the same line or branches, we’ve only observed three markers that are genealogically relevant. It is helpful to note that the Cobourg line and the Ganton branch are overrepresented in the study, as it was necessary to check research that was conducted 20 years ago to ascertain if the conclusions reached at the time were valid. More on that later. The relevant markers include DYS631, DYS489, and FTY510.

DYS631 at 11 repeats rather than the modal of 10 is a signature of the Cobourg line of the Sherburn family. All three participants who descend from William Owston (1778-1857) carry this result. This joins the signature value of 11 instead of 12 repeats on DYS643 in Panel Five. Five of the six members of the Cobourg line share this value; the sixth appears to be a back mutation. In addition, the three members of the Cobourg line share the A10921 SNP.

DYS489 at 13 markers as opposed to the modal of 12 is shared by all four members of the Ganton branch of the Sherburn family who have tested with the Big Y. This is the only STR marker that is indicative of this branch, which descends from Thomas Owston (1755-1823) of Ganton, North Yorkshire. These participants also share the A10208 SNP.

FTY510 with 10 repeats as opposed to nine are shared by two seventh cousins, once removed who descend from Richard Owston (c. 1670-1739) from Thornholme in the parish of Burton Agnes in the East Riding of Yorkshire. This family also shares another signature STR: Panel Four’s DYS481 at 25 markers as opposed to the modal of 26. There is also a unique SNP for the Thornholme family – A15739. 
Further Big Y testing may reveal other STR markers with genealogical significance; however, without Panel 6, we’ve had SNPs that were family specific in all three cases and other STRs in two of the three groups.

GENETIC DISTANCE AT 561 MARKERS 


As we determined with our study that the additional 450 markers provided little genealogical value, do they provide the ability to predict relationships based on genetic distance? I analyzed 91 relationships from among our 14 participants.

Two distinct families who share a common ancestor born in the late 1400s comprise our study: the Sherburn family represents 91% of Owston and Ouston males, while the smaller Thornholme family round out the additional 9%. Two Thornholme participants are represented with Big Y testing.

The exact relationship between the Sherburn and Thornholme families is not presently known; however, by analyzing naming patterns, the closest possible relationships are represented here. There are other possibilities that would place the relationships one to two generations further back in time, but not closer. The two families were familiar with each other and it is believed that both are descended from John Owston who died in 1520. These conjectured relationships are identified with an asterisk.

The Big Y results represent the following relationships:

  2nd Cousins, Once Removed1
  4th Cousins4
  5th Cousins1
  5th Cousins, Once Removed2
  6th Cousins2
  7th Cousins1
  7th Cousins, Once Removed6
  8th Cousins6
  8th Cousins, Once Removed14
  8th Cousins, Twice Removed3
  9th Cousins10
  9th Cousins, Once Removed6
  9th Cousins, Thrice Removed1
10th Cousins, Twice Removed7
11th Cousins, Once Removed3
12th Cousins*1
12th Cousins, Once Removed*8
12th Cousins, Twice Removed*3
12th Cousins, Thrice Removed*1
13th Cousins*7
13th Cousins, Once Removed*3
13th Cousins, Twice Removed*1

The following chart plots genetic distance based on time to the most recent common ancestor (TMRCA). There were 14 instances where one party had a mismatch from the modal results and the comparison individual had a no-call. In these cases, the no-call was treated as having the modal result. This was an arbitrary decision that should not greatly affect the overall results.

The lowest GD was 1 for two fourth cousins, while the greatest GD of 20 was found between pairs of seventh cousins; seventh cousins, once removed; and 13th cousins. One of the parties was an outlier, as he had a value of 5 at DYS602, while the modal value was 12. The dots in the chart below often represent more than one relationship at that TMRCA and GD combination.


CONCLUSIONS 


As one notices from the above chart, the results vary greatly. While relationship distance increases, GD correspondingly increases; however, there is enough variability from seventh cousins and beyond that the predictability of the Big Y500 based on genetic distance is tenuous at best. Even in the closer relationships, it is impossible to accurately predict a relationship based solely on genetic distance. Fourth cousins have a GD range of 1 to 10.

Because of this and the presence of very few genealogical relevant markers identified for our family, I am hesitant to believe that the addition of these 450 markers provide much value for our purposes. The SNP results in the Big Y and the first five panels in the 111 test should be adequate in determining lineage signature markers. The SNP results are the real value of the Big Y test.

As Kelly Wheaton astutely added on her All Genetic Genealogy Facebook group, “The point that needs underscoring is that STRS change back and forth so their predictive value is less than SNPS that you either have them (and so do all your Y line descendants) or you don't. They are definite and predictive and now with Next Gen sequencing they are useful in a genealogical time frame. Sometimes STRS are helpful but they can also be misleading and have you barking up the wrong tree.”

While this is only one family and one set of results, other projects may reach different conclusions. Furthermore, different haplogroups may provide better return on value. More data will need to be gathered to better ascertain the overall value of the Big Y500.

Saturday, February 10, 2018

The Strange Case of the Missing Y37 Match


The other day the subject arose in a Facebook group about the possibility of matching someone at 67 Y-STR resolution while simultaneously not matching that same person at 37 markers. The conclusion was that this was a rare occurrence.  

In our project, several participants were not matching documented relatives with the same surname at 37 markers, but they had subsequently matched these same individuals at 67 markers; I realized that this was a significant occurrence in, at least, our project and set out to see if it included non-family members as well.

SURNAME PROJECT BACKGROUND


Since the 1970s, three researchers have been cataloging past and present descendants of two extant and three extinct families with our surname that ramified in what is now the Ryedale District of the present county of North Yorkshire, England.  It is estimated by counting the number of cataloged males that 296 exist to the present.  With a 5% margin of error, that number increases to 311.  We are a very low frequency surname that has three current variations Owston (72%), Ouston (26%), and Owston-Doyle (2%). 

The Owston/Ouston DNA project began in 2010 and has risen to 33 Y-DNA participants.  About 10.6% of the entire male population of our surname has had their Y-DNA tested. Not counted in this percentage are six other Owston males who have tested autosomally and most certainly match the surname haplotype due to matching autosomal DNA to those who have tested their Y-DNA.  Four of these males have been identified as having the I1 (I-M253) haplogroup via 23andMe.  Our participants were recruited from the United States, England, Canada, New Zealand, Australia, and Finland.  Including all autosomal participants, we have 62 members total.

Of our 33 Y-STR participants, ten have a paper ancestry to one of the two extant families, but these ten have ancestral non-paternal events and do not match the family modal haplotype.  Five of the remaining 23 tested at GeneTree with a 43-marker test between 2010-2012.  The remaining 18 have all tested at Family Tree DNA at 111 markers. In addition, 15 have tested with the Big Y (with two tests pending).   

Of the 18 participants, there are 153 relationships that range from a sibling pair to 13th cousins, twice removed. Relationships of 12th cousin and beyond are estimated due to onomastic evidence linking the two families to a common source born in the latter half of the 15th century; the closest possible relationship is used for the estimates; the relationships should be no further than two additional generations than our estimation.  

The first documented use of the surname in the region dates to 1452. Big Y participants from both families share A10206 and 14 additional phylogenetic SNPs. The Sherburn family (including its Cobourg and Ganton subsets) all share BY31751, while the Thornholme family members share the A15739 SNP. 

67-MARKER MATCHES ABSENT AT 37 MARKERS


In analyzing the matches of 18 matching FTDNA Y-STR participants in the Owston/Ouston DNA study, 100% of the men who tested at 67 markers matched at least one individual who was not found in their 37-marker match list. The numbers ranged from one to six non-matching individuals at 37 markers with the average being 3.77.  The percentage of non-matches at 37 within the 67-marker match list ranged from 3.6% to 35.3% of their total 67-marker matches.  An average of 14.1% of their 67-marker matches were absent from their 37-marker match list. 

The following table shows the total matches at 67 markers and the number of these matches that are missing from their 37-marker list. A percentage of the whole is also provided. 


KNOWN FAMILY 67-MARKER MATCHES ABSENT AT 37 MARKERS


Eight of our 18 participants (44.4%) had non-matches with a family member at 37 markers.  This is a significant number and can be greatly attributed to a person’s genetic distance from the family modal haplotype. Even a genetic distance of 1 when paired with a genetic distance of 4 will produce an absence of a match at 37 markers.  This is a factor that could be extremely important to genetic genealogists, as there may be a matching family member at 67 markers that does not show in the participant’s list at 37. 

The following table provides an analysis of missing family members at 37 markers.  In order to understand this phenomenon, the participant’s genetic distance from the surname model haplotype is listed.  Each person should have 17 matching family members at 37 markers; however, eight individuals are missing one or several matches to family members they match at 67 markers.   

 
The absent family members at 37 markers in our project included the following relationships:

  • One seventh cousin, once removed pair;
  • One seventh cousin, twice removed pair;
  • Two eighth cousin, once removed pairs;
  • One eighth cousin, twice removed pair;
  • Two ninth cousin pairs;
  • One ninth cousin, once removed pair;
  • One ninth cousin, thrice removed pair; and 
  • Three tenth cousin, twice removed pairs.  

The 12 relational pairs represent 7.8% of the total number of matching family relationships (153) at 67 markers.   

An interesting development with absent matches at 37 markers is that this phenomenon occurred intra-family within the Sherburn family and was not present with matches to the more distantly related Thornholme family.  Some of this may be attributed to a lack of viable participants within the Thornholme family. 

Although the Thornholme family is rather small with only 25 living males, all four lines have been tested.  Of the 25 aforementioned males, 14 have non-paternity events within their ancestries.  Of the 11 potentially remaining matching members, three have tested (one at 43 markers).  The other eight are closely related to at least one participant who has already tested. Among those not tested, the most distant relationship is that of a first cousin, twice removed.  It is not likely that any new data would be gained in further testing any of the remaining eight Thornholme men.

CONCLUSION


Do not discount the possibility that match may exist at 67 markers but be absent at 37 markers.  In our family, 100% of our participants were missing at least one 67-marker match at 37 markers. Forty-four percent of our participants were missing at least one family member at 37 markers.  One participant was missing six and another missing five family members.  

While the data presented has a small sample size and is only indicative of our singular family project, the results may differ from the general population of FTDNA Y67 results. Therefore, it is suggested that a similar analysis be replicated within a haplogroup project to see if the results are consistent.